The CRI Anna-Maria Kellen Clinical Accelerator team presents an unbiased and scientifically curated analysis of PD-1/PD-L1 agents in development, in clinical trials, and approved by the FDA, EMA, NMPA, and PDMA. Data is based on information collected from numerous trusted and publicly available sources. We hope to inform the cancer research community through academic publications as it strives for efficiencies and innovation while avoiding duplication.
PD-1/PD-L1 Landscape
The clinical development of PD-1/PD-L1 agents is at the epicenter of immuno-oncology drug development. We created an interactive dashboard of active interventional trials with approved and other PD-1/PD-L1 agents as well as targets used in combination therapy trials.
Anti-PD-1/PD-L1 Monoclonal Antibody Clinical Trial Landscape.
PD-1/PD-L1 Approval Timelines
The growth of PD-1/PD-L1 is reflected globally. We created timelines of government approvals to demonstrate the growth in this area.
Timeline of Anti-PD-1/PD-L1 Antibody Approvals by the U.S Food and Drug Administration (FDA).
Timeline of Anti-PD-1/PD-L1 Antibody Approvals by the European Medicines Agency (EMA) for the European Union (EU), National Medical Products Administration (NMPA) for China, and Pharmaceuticals and Medical Devices Agency (PMDA) for Japan.
2021 PD-1/PD-L1 Analysis
One February 10, 2022, CRI published an annual review, summarizing the clinical development of PD-1 and PD-L1 checkpoint inhibitors. The number of clinical trials started each year that include a PD1/PDL1-targeting agent has continued to increase, currently at 5,683 worldwide, up 278% from the number of trials reported in 2017. The ratio of monotherapy (single-agent) PD1/PDL1-blocking drug trials continues to decrease while the number of combination studies is on the rise. Planned patient enrollment in monotherapy trials has been falling precipitously, a seven-fold decrease since 2014, while combination trial enrollment projections have seen less than a two-fold drop since 2015.
Bispecific antibodies represent a significant growth area in combination trials, which together interrogate 28 different targets/mechanisms including checkpoint pathways other than PD1/PDL1.
For further detailed analysis, see our paper in Nature Reviews Drug Discovery. See below for several charts included in the Ferbuary 2022 publication.
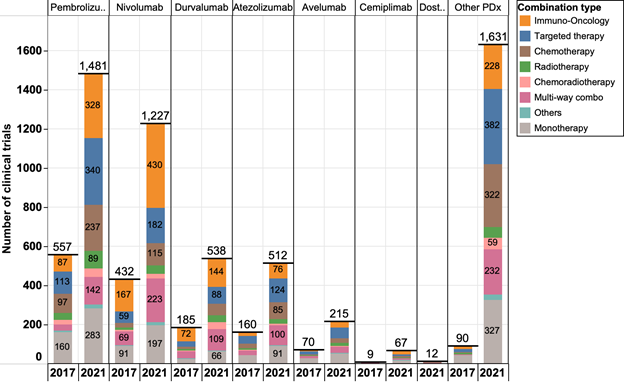
Figure 1. The landscape of anti-PD1/PDL1 mAb clinical trials in 2017 and 2021. As of December 2021, there are 5,683 clinical trials assessing anti-PD1/PDL1 mAbs. Other PDx includes any anti-PD1/PDL1 mAbs without FDA approvals.
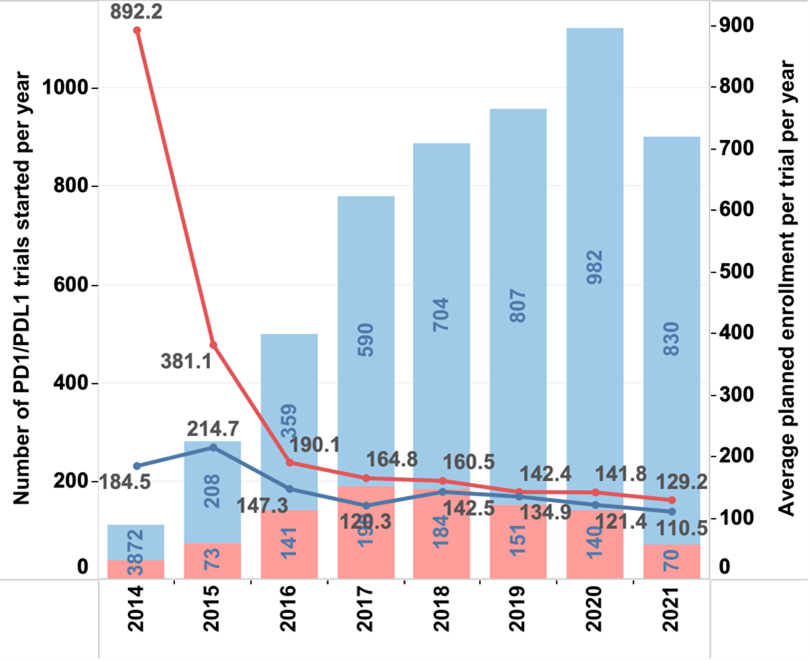
Figure 2. Comparison of monotherapy and combination trials. Most new trials since 2014 have been combination trials (bar graphs). The average planned patient enrolment (line graph) has decreased since 2014 for monotherapy trials more than for combination trials.
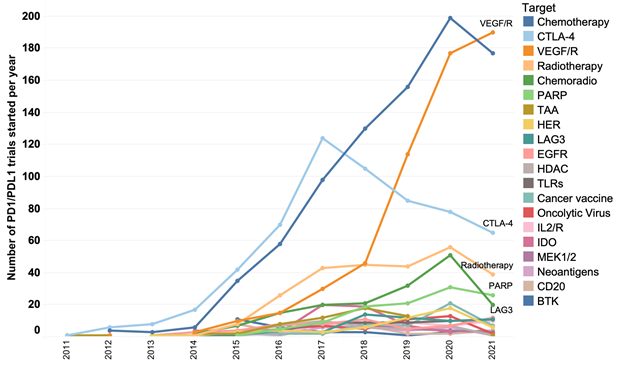
Figure 3. Main targets assessed in combination with anti-PD1/PDL1 mAbs. The graph shows the number of combination trials starting each year since 2011. The top 20 targets assessed in combination are shown in descending order according to the number of trials started in 2021.

Supplementary Figure 1. The growth of landscape of anti-PD1/L1 mAb clinical trials from 2017 to 2021. FDA-approved mAbs include pembrolizumab, nivolumab, durvalumab, atezolizumab, avelumab, cemiplimab, and dostarlimab. Other PDx include mAbs approved by regulatory agencies other than the FDA such as the EMA as well as those in clinical development and not yet approved.
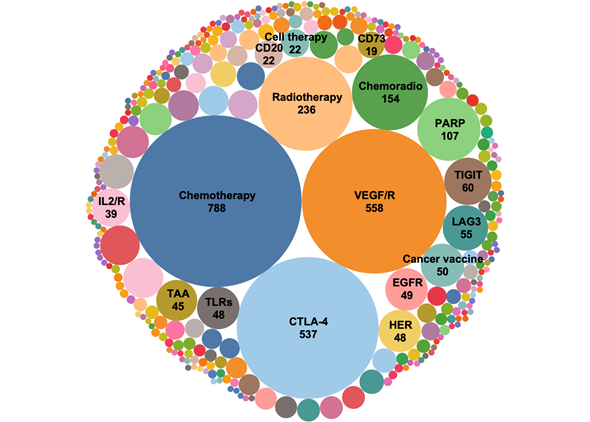
Supplementary Figure 2. Target landscape of combination trials in 2021. Similar targets are grouped together to better identify trends in year-to-year analyses.
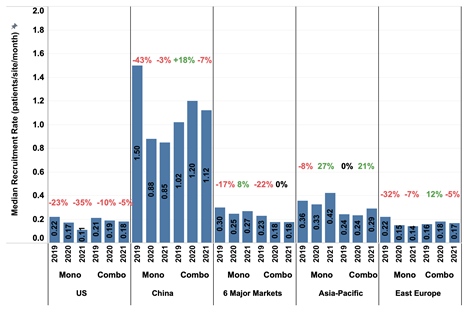
Supplementary Figure 3. The median patient recruitment rate (RR) in different countries or regions in 2019 and 2020 compared to 2021 with the percent change between consecutive years. Data from three consecutive years are included to provide a comparative analysis of potential effects of COVID-19 pandemic on patient RR. (A detailed analyses on the impact of COVID-19 on oncology clinical trials can be found in our previous publication.) Six major markets are France, Germany, Italy, Japan, Spain, and United Kingdom. The Asia-Pacific (APAC) area includes Australia, Hong Kong, Korea, New Zealand, Taiwan, and Thailand, while excluding China and Japan. Mono and Combo denote monotherapy and combination therapy trials respectively.

Supplementary Figure 4. Heatmaps showing change (increase) in the utilization of three generations of anti-PD1/L1 mAbs pembrolizumab (top), atezolizumab (middle), and cemiplimab (bottom) in grams active substance on country level over time (2016, 2018, and 2020). Data is normalized in grams per million country population to represent the relative utilization per capita. The color scales have been synchronized across the heatmaps on drug level so that the same shade of green is associated with the same quantity active substance. The time period of 2 years was decided to give best ratio between number of heatmaps and visible difference (growth) of the utilization.
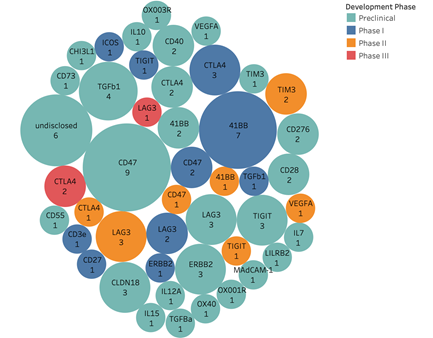
Supplementary Figure 5. Landscape of PD-1/L1 bispecific antibodies. Shown are targets and number of clinical programs with colors representing different development stages. (56 preclinical 27 targets; 20 phase I 10 targets; 10 phase II 7 targets; 3 phase III 2 targets)
2020 PD-1/PD-L1 Analysis
On November 11, 2020, CRI published an annual review, summarizing the clinical development of PD-1 and PD-L1 checkpoint inhibitors. Compared to our initial 2017 report, clinical trials testing PD-1/PD-L1 checkpoint inhibitors have tripled in three years to 4,400 clinical trials (3,674 are ongoing). This past year has seen the greatest year-on-year growth with 1,358 trials added to our landscape between 2019 and 2020. This growth has been led by combination trials; 90% of the new trials started in 2020 are combination strategies.
As COVID-19 continues to impact clinical development, we collaborated with IQVIA to better understand real-world recruitment of completed or ongoing IQVIA managed PD-1/PD-L1 checkpoint inhibitor clinical trials from trial sites globally compared to 2019. Monotherapy trial recruitment rates were more affected than combination trial recruitment rates globally.
A key shift in target strategy also occurred in 2020, where combinations with VEGF/VEGFR targeted therapies rose exponentially compared to chemotherapy or CTLA-4 checkpoint inhibitors. A sharp increase in the use of novel combinatory agents was also observed.
For further detailed analysis, see our paper in Nature Reviews Drug Discovery. See below for several charts included in the November 2020 publication.

Figure 1. The growth of landscape of PD-1/L1 mAb clinical trials from 2017 to 2020. 4,400 clinical trials are in the current landscape as of September 2020, nearly tripling since in September 2017. FDA-approved mAbs include pembrolizumab, nivolumab, durvalumab, atezolizumab, avelumab, and cemiplimab. Other PDx include mAbs approved by regulatory agencies other than the FDA such as the EMA as well as those in clinical development and not yet approved
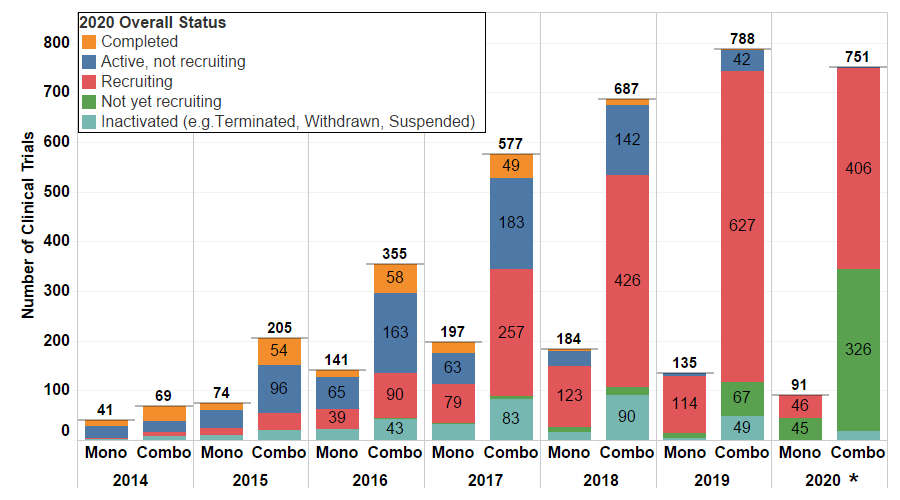
Figure 2. PD-1/PD-L1 monotherapy and combination trials started from 2014 to 2020 (*Only data from the first 3 quarters of 2020 were used to generate the analysis in the chart above.) The majority of trials started in last 4 years remain in recruitment phase, where the most recent trials have not started recruitment.
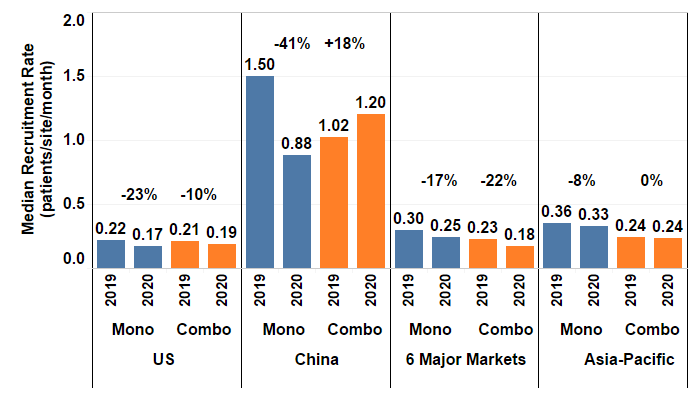
Figure 3. The median patient recruitment rate in different countries or regions in 2019 compared to 2020 with the percent change between the years. Six major markets are France, Germany, Italy, Japan, Spain and United Kingdom. The Asia-Pacific (APAC) area includes Australia, Hong Kong, Korea, New Zealand, Taiwan, and Thailand, while excluding China and Japan. Mono and Combo denote monotherapy and combination therapy trials respectively.
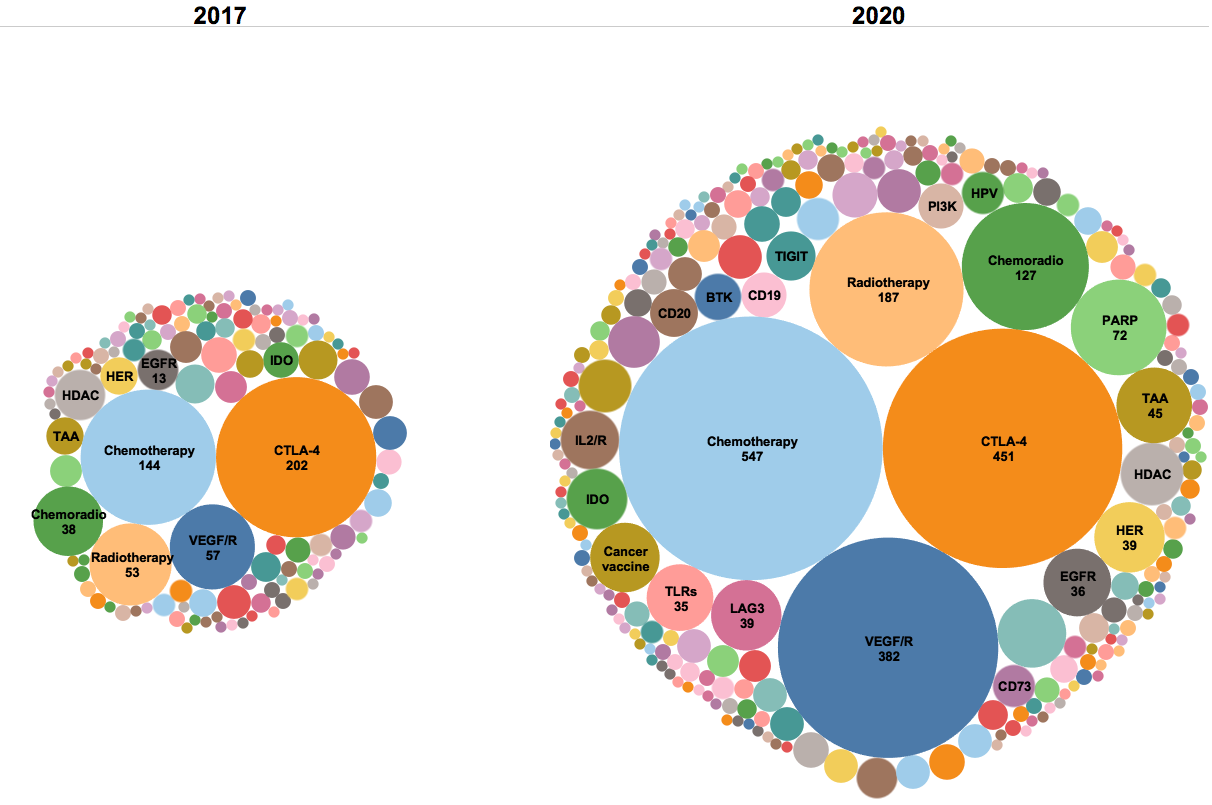
Figure 4. Target landscapes of combination trials in 2020 and 2017. The number of combination trials has more than tripled in the past three years (2,900 compared to 857), with an increase of 129 additional combination target groups from 124 target groups. Similar targets are grouped together to better identify trends in year to year analyses.
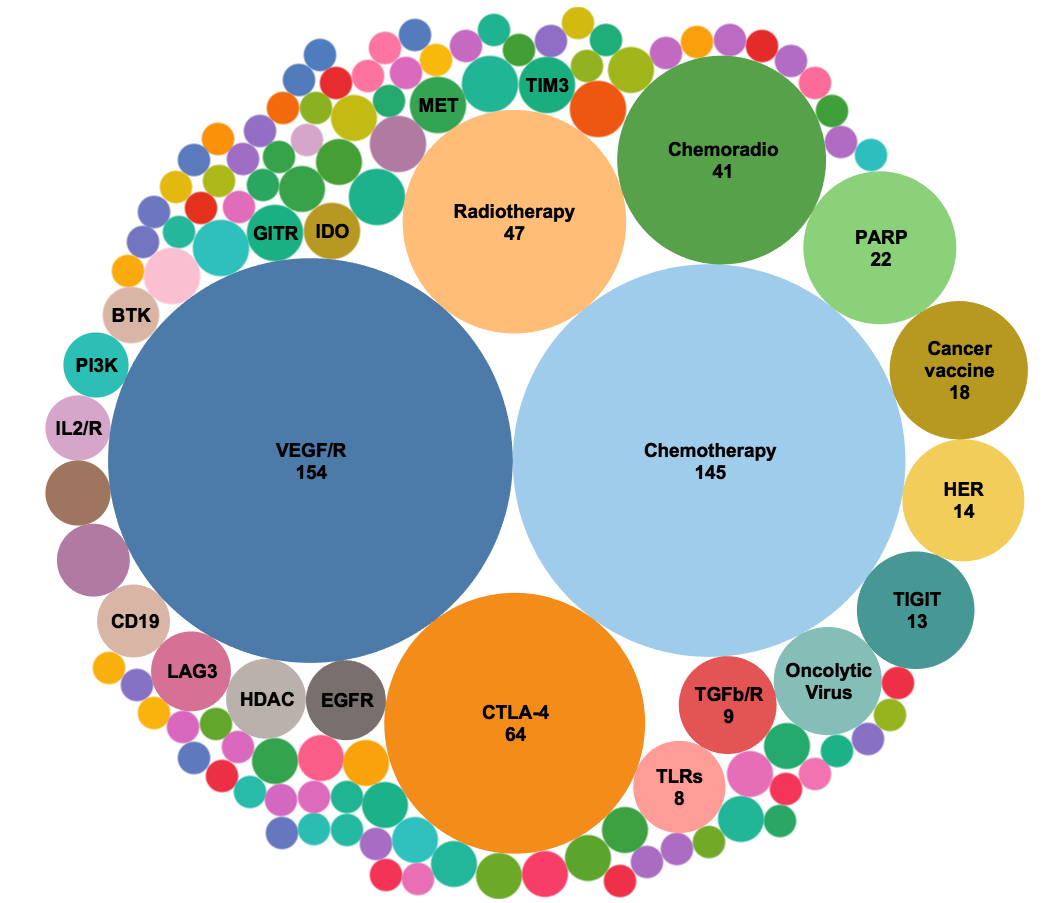
Figure 5. Analysis of new combination trials (724 trials) starting in the year 2020.* When trials targeting VEGF and VEGFR were pooled together, this mechanism-of-action is the largest target of PD-1/PD-L1 combination trials opened in the past year exceeding chemotherapy and CTLA-4 combination trials. Targets of immuno-oncology agents comprise many of the emerging targets. *Only first 3 quarters of 2020 are included in the analysis.
2019 PD-1/PD-L1 Analysis
In November 2019, we made another comprehensive analysis of the current clinical trial landscape of PD-1/PD-L1 immune checkpoint inhibitors, highlighting the exponential growth rate trials since 2006. As of September 2019, 2,975 out of the 3,363 PD-1/L1 checkpoint inhibitor trials conducted since 2006 are still active. Due to the effectiveness of such therapies, the combination of anti-VEGF/VEGFR with PD-1/PD-L1 checkpoint inhibitors has received three FDA approvals and is now one of the leading interventions in this space. We found that the median patient recruitment rate per clinical site in China to be six times higher than that in the U.S. using real-world data from IQVIA’s completed and ongoing PD-1/PD-L1 clinical trials. The large number of eligible and previously untreated patients in emerging markets can thus greatly benefit as PD-1/L1 trials expand overseas. For further detailed analysis, see our paper in Nature Reviews Drug Discovery. See below for several charts included in the November 2019 publication.

Figure 1. The landscape of PD-1/PD-L1 mAb clinical trials in 2017 and 2019. Four more new PD-1 mAbs were approved globally in the past two years, namely cemiplimab, sintilimab, toripalimab, and camrelizumab. 2,975 active trials are in the current landscape, compared to 1,506 in September 2017.

Figure 2. Target landscapes of combination trials in 2019 and 2017. The number of combination trials has doubled in the past two years, with an increase of 136 additional combination targets.
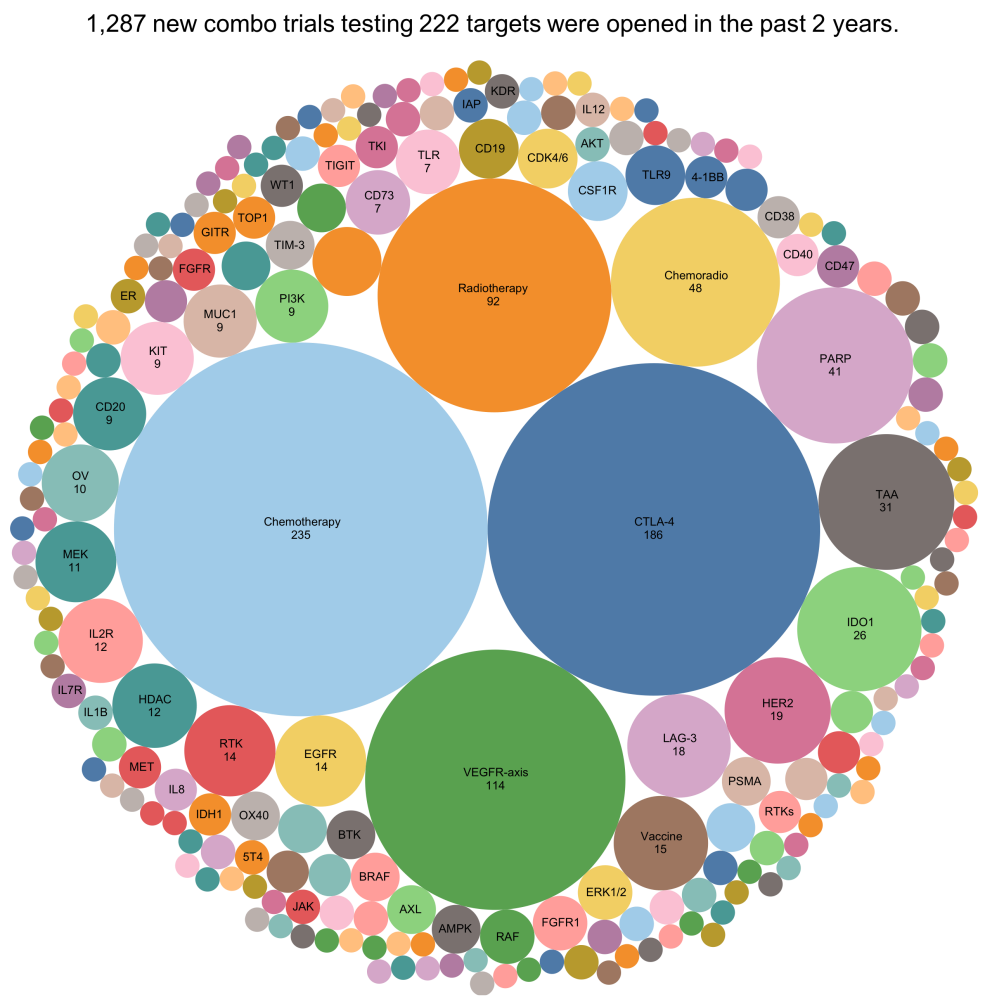
Figure 3. Analysis of new combination trials started in the past two years. When trials targeting VEGF and VEGFR were pooled together under “VEGFR-axis”, this mechanism-of-action becomes the third largest target of PD-1/PD-L1 combination trials that were opened in the past two years.

Figure 4. Average planned patient enrollment goes down since 2014.
*Only data from the first 3 quarters of 2019 were used to generate the analysis in the chart above.

Figure 5. The evolution of new trials started per year by different cancer types. Cancer types with approved PD-1/PD-L1 mAbs have shown either decrease of new trials (e.g., melanoma and kidney cancer) or slow growth per year recently (e.g., lung cancer and breast cancer). All other trials were grouped to either “Other cancers” when the tested cancer type has no approved PD-1/PD-L1 mAbs, or “All advanced cancer” when the trials recruited all cancer types or did not specify cancer types to be tested.
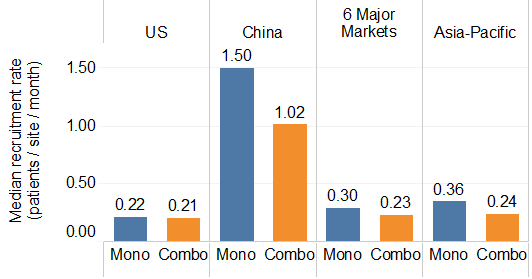
Figure 6. The median patient recruitment rate in different countries or regions. Six major markets are France, Germany, Italy, Japan, Spain and United Kingdom. The Asia-Pacific area includes Australia, Hong Kong, Korea, New Zealand, Taiwan, and Thailand. Mono denotes monotherapy trials; Combo denotes combination therapy trials.
2018 PD-1/PD-L1 Analysis
In November 2018, we made a comprehensive analysis of the current clinical trial landscape of PD-1/PD-L1 immune checkpoint inhibitors. This report also compares the current landscape with the previous one surveyed by CRI one year ago. 2,250 clinical trials are evaluating PD-1/PD-L1 immune checkpoint inhibitors, an increase of 748 trials over the past year. 1,716 trials are assessing regimens that combine PD-1/PD-L1 immune checkpoints with other cancer therapies. 240 drug targets are being evaluated in the current landscape, 75 more targets compared to a year ago. Over 380,000 patient volunteers are required to fill all trials and there is 70% decrease of median patient recruitment rate of combination trials recently. For further detailed analysis, see our paper in Nature Reviews Drug Discovery. See below for several charts included in the November 2018 publication.
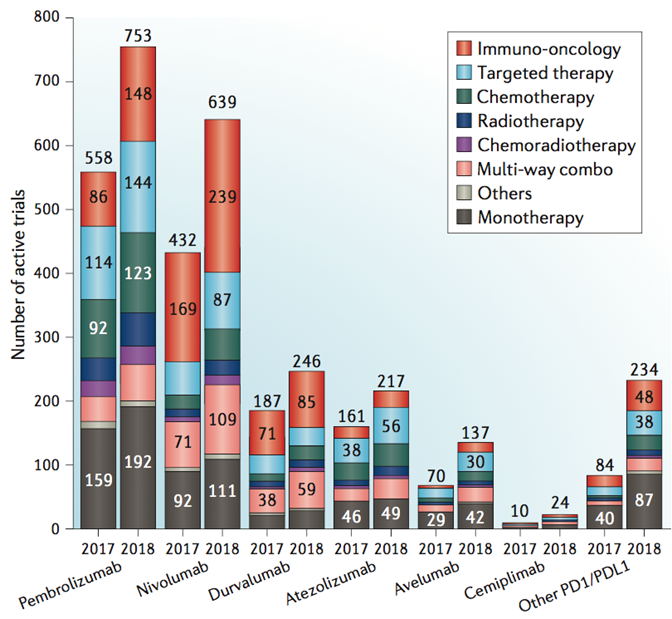
There are 2,250 active trials testing anti-PD-1/PD-L1 agents as of September 2018, compared with 1,502 trials in September 2017. An increase of 748 trials in one year.
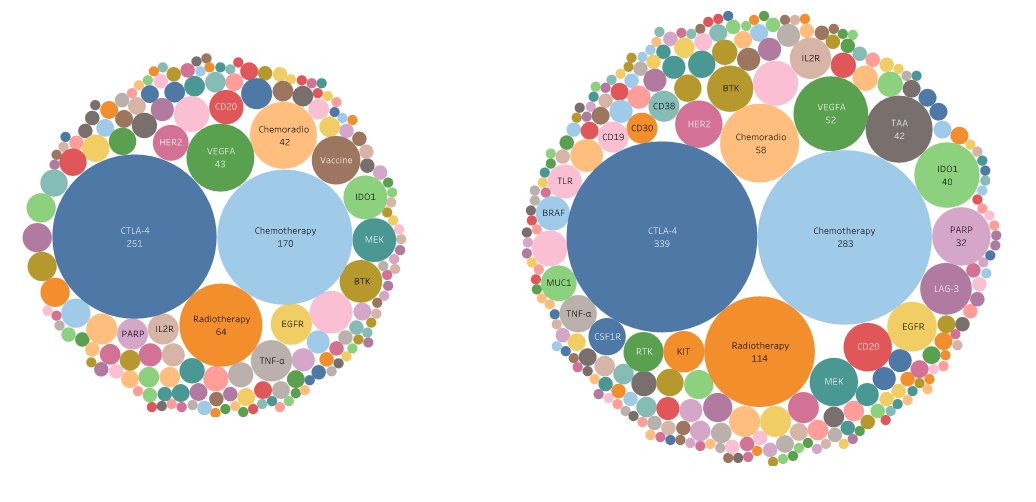
614 more PD-1/PD-L1 combination trials added to this space in a year. In 2017, 1,102 trials testing 165 targets (including trials listed on clinicaltrials.gov but not yet launched). In 2018, 1,716 trials testing 240 targets.
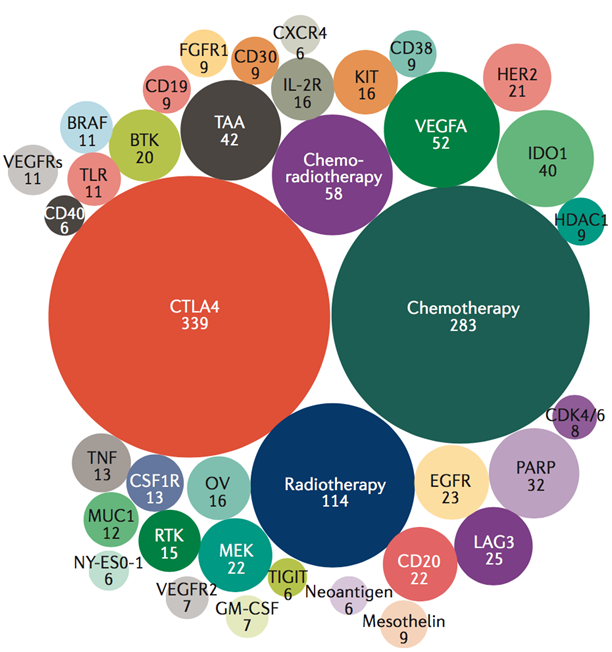
The top 38 targets in the current PD-1/PD-L1 combination trial space. The 1,332 trials evaluating anti-PD-1/PD-L1 agents in combination with the top 38 targets (among the 1,716 combination trials testing a total of 240 targets) are shown here. We have selected those targets being evaluated in at least 6 trials. The number of active clinical trials that are testing drugs against the target are indicated in each bubble.
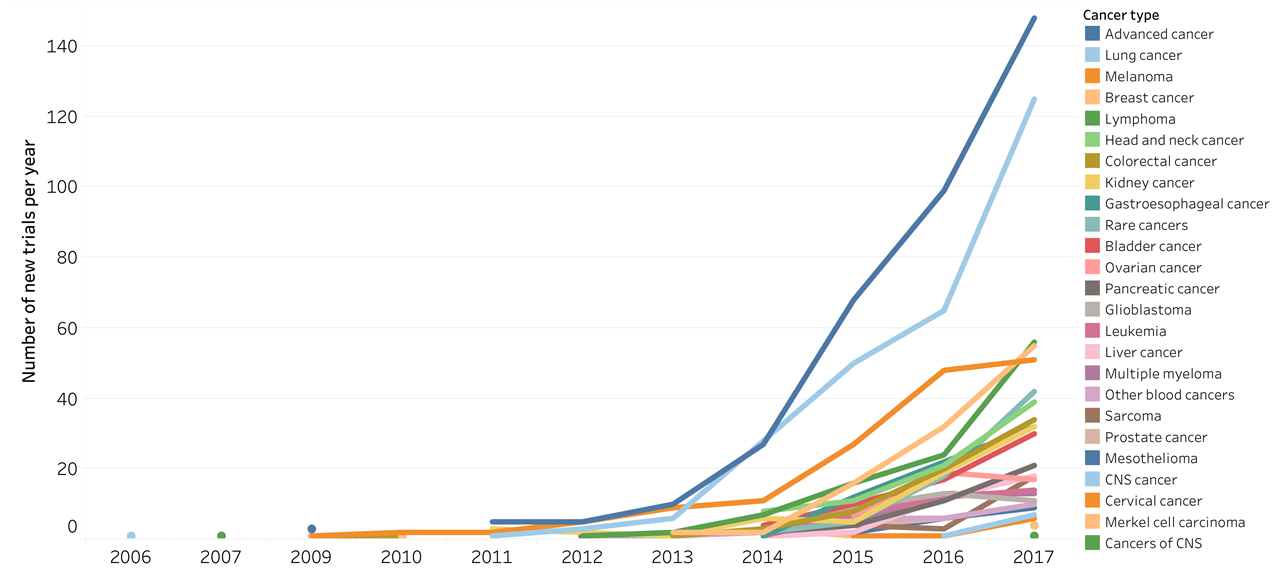
Evolution of PD-1/PD-L1 trials by different cancer types.
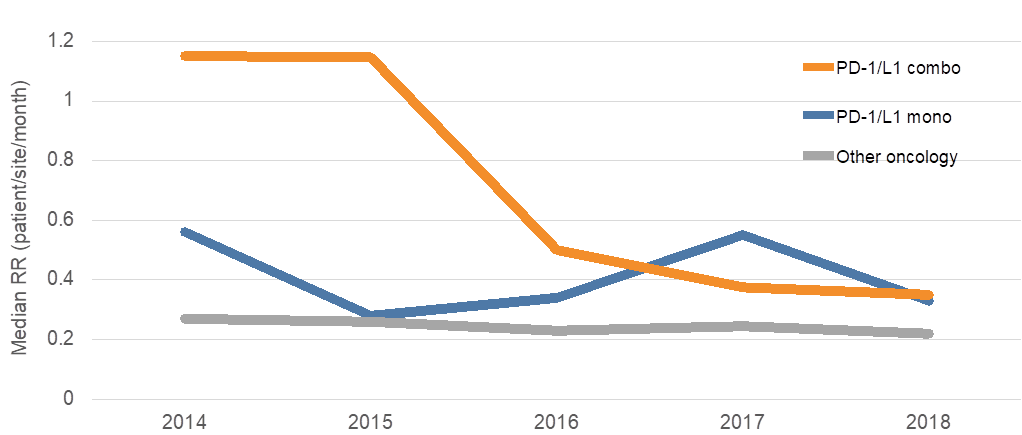
70% decrease of patient recruitment rate for PD-1/PD-L1 combination trials. Many trials may face a shortage of patient volunteers as the median patient recruitment rate (RR; patients per site per month) for PD-1/PD-L1 combination trials has significantly decreased in the past 4 years.
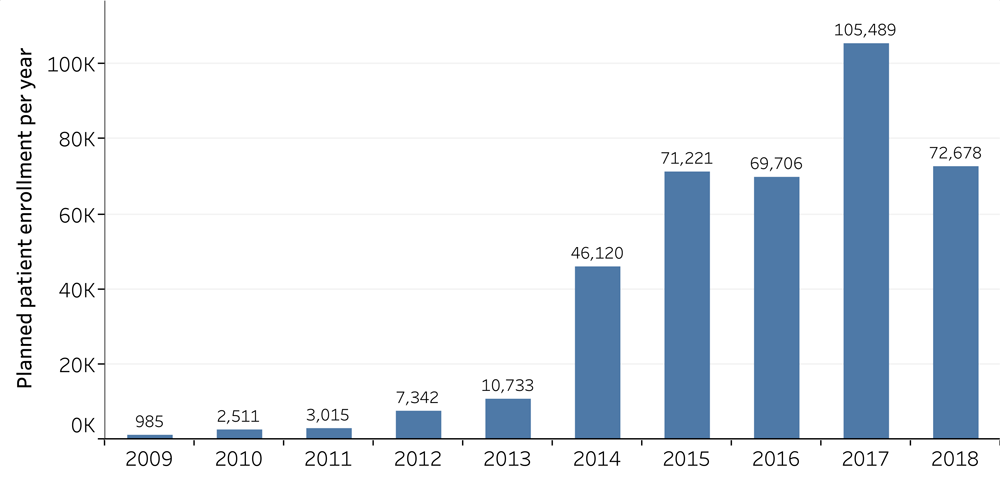
The requirement of patient volunteers of PD-1/PD-L1 trials. 2,399 PD-1/PD-L1 trials have been started since 2006, with 2,250 being currently active. The combined sum of patient volunteers from all trials reach to 389,900. The new trials launched in 2017 alone planned to recruit a total 105,489 patients. The data cut-off was September 2018.
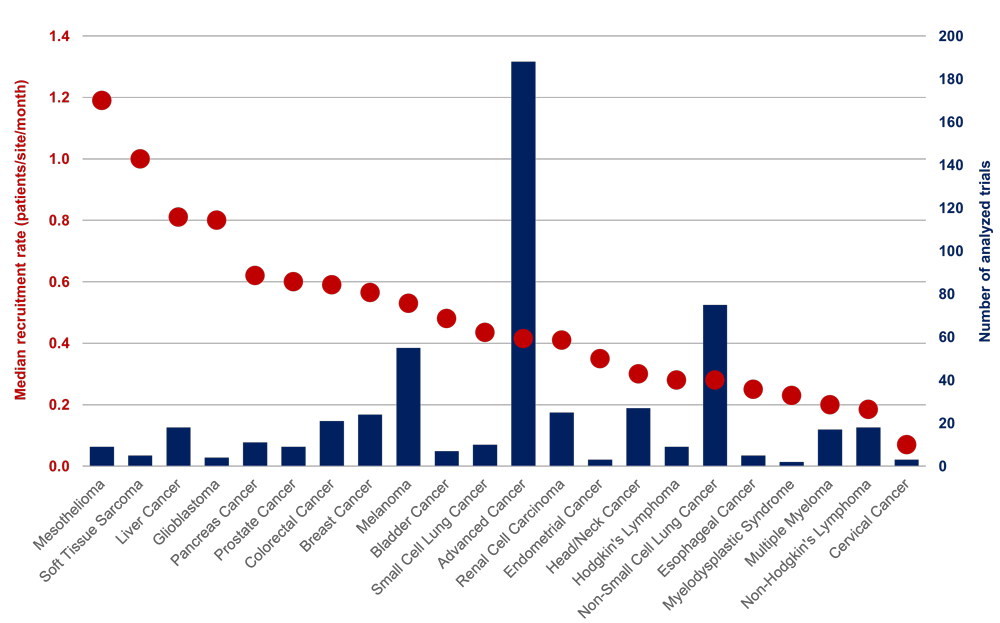
Recruitment rate of PD-1/PD-L1 trials in different cancer types. The analysis included 533 PD-1/PD-L1 trials that had recruitment data on Citeline or Infosario. The current status of these trials are active but their recruitment status is ongoing or complete. Citeline is a clinical trial database from Pharma Intelligence, and Infosario is an analytical tool developed in IQVIA.
2017 PD-1/PD-L1 Analysis
In our first academic publication (Annals of Oncology, December 2017), we made a comprehensive IO landscape analysis and highlighted the PD-1/PD-L1 landscape in particular. At the time of publication there were 164 agents targeting PD-1/PD-L1, of which 50 were in clinical stages with five having already received FDA approval. These 50 agents were being evaluated in 1,502 studies, of which 1,105 were combination trials. Importantly, the analysis found that most of these trials are small, single-center, investigator-initiated trials. For further detailed analysis, see our paper in Annals of Oncology.
PD-1/PD-L1 Analysis Publications
PD-1/PD-L1 landscape publications include:
Read more IO landscape publications
Please note that all landscape dashboards are integrated with the CRI iAtlas for further exploration of the molecular targets.
IO Landscapes
Download a PDF of the latest CRI landscape figures
Data Sources: Cancer Research Institute (CRI) analytics derive from public data sources, including trade news, company press releases, academic publications, FDA announcements, clinicaltrials.gov, and conference reports, and proprietary data sources including, but not limited to, GlobalData. The analytical algorithm and visualizations are developed by and therefore sole property of Cancer Research Institute.
Subscribe to our email newsletter to receive the latest updates on our landscape analyses.
Do you want more information on the Clinical Accelerator? Contact us.